New model for the spread of infectious diseases: Predicting epidemics better
The reproduction number R is often used as an indicator to predict how quickly an infectious disease will spread in society. Empa researchers have developed a mathematical model that is just as easy to use as R, but enables more accurate predictions. Their model is based on a "reproduction matrix" that takes into account the heterogeneity of society.

"Your friends have more friends than you", wrote the US sociologist Scott Feld in 1991. Feld's so-called "friendship paradox" states that the friends of any given person have more friends on average than the person themselves. This is based on a simple probability calculation: well-connected people are more likely to appear in other people's circles of friends. "If you look at the circle of friends of any person, it is very likely that this circle of friends contains very well-connected people with an above-average number of friends," explains Empa researcher Ivan Lunati, head of the Computational Engineering laboratory. A similar principle served Lunati and his team as the basis for a new mathematical model that can be used to more accurately predict the development of case numbers during an epidemic.

But what do circles of friends have to do with infectious diseases? "The more contacts a person has, the more people they can infect in an epidemic," explains Lunati. Conventional epidemiological models, however, assume that each infected person infects the same number of other people on average over the course of the epidemic. This number is referred to as the reproduction number (R). If R is greater than one, the number of cases increases exponentially; if R is less than one, it decreases.
Of course, this model is simplified: "The number of cases cannot increase indefinitely, as the population is not infinitely large," says Lunati. The rapid exponential growth occurs mainly at the beginning of a wave, according to the researcher. Over time, there are fewer and fewer people who can still be infected, so the R-value decreases and the increase in new infections slows down until there is finally an infection peak and the number of cases starts to fall again - a curve that most people are probably familiar with after the Covid pandemic.
Not an infinite number of "superspreaders"
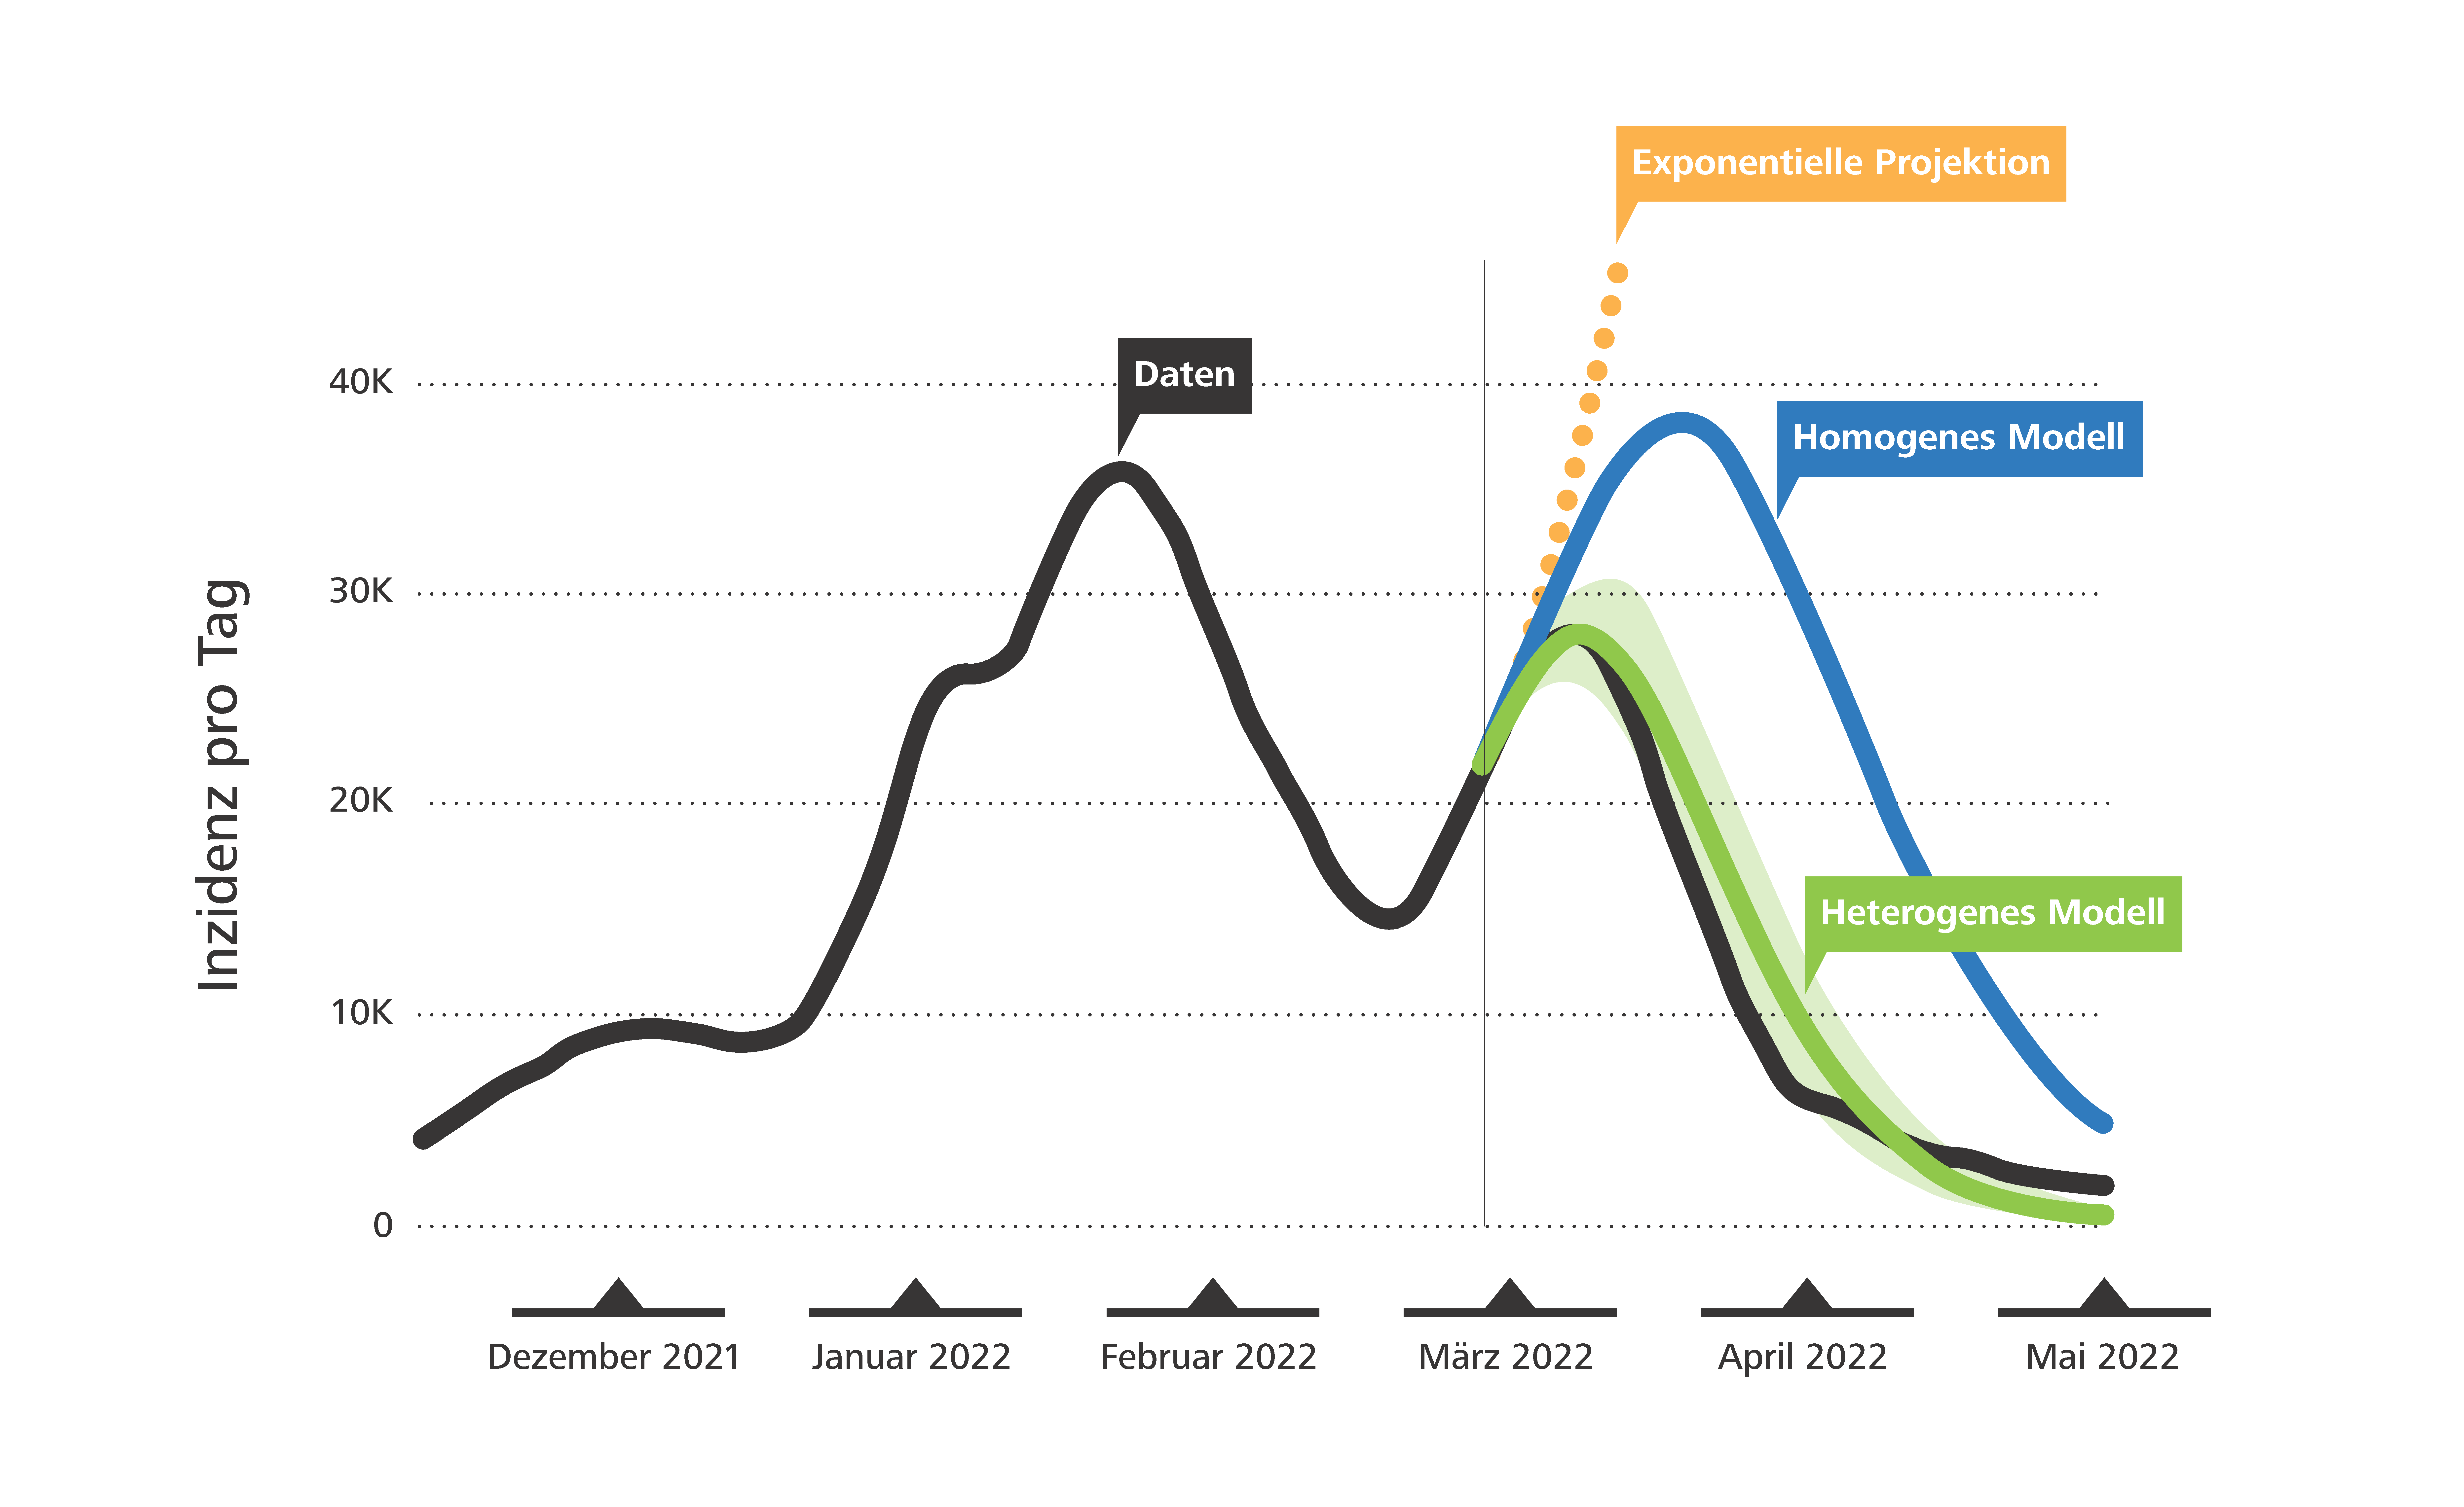
This infection curve can be calculated using mathematical methods to predict its peak. However, if we assume that each infected person infects the same number of other people, the model deviates from the empirically measured waves of infection. Although it can reproduce the beginning of the wave well, the wave of infection ebbs more quickly than predicted later on, so that the peak ultimately turns out to be somewhat lower than in the model calculation - even if no new protective measures influence the course of the infection.
Together with Empa researcher Hossein Gorji and Noé Stauffer, a doctoral student at Empa and EPFL, Lunati asked himself the question: How do we make such predictions more accurate? Their answer has parallels with the friendship paradox. "People with many social contacts become infected particularly quickly, and in turn infect many others," explains Lunati. Researchers also refer to such people as hubs or superspreaders. At the beginning of a wave of infections, they are the ones who drive the increase in the number of cases. However, the number of such superspreaders in society is relatively small. Once they are all infected - which happens relatively quickly due to their many contacts - the spread of the disease slows down. Conventional models based on the reproduction number R do not take this slowdown into account.
In a study recently published in the "Journal of the Royal Society Interface", Gorji, Stauffer and Lunati therefore propose the use of a so-called reproduction matrix instead of the reproduction number. This matrix indicates how quickly individual population groups become infected and thus takes into account the heterogeneity of society. "We wanted to go beyond the simplified interpretation of the reproduction number R and better capture the complexity of real epidemic waves," says Hossein Gorji. "The reproduction matrix allows us to predict the spread of disease more accurately by taking into account both the non-linearity and heterogeneity that are often overlooked in conventional models." The research project was supported by the Swiss National Science Foundation (SNSF).
Also for other networks
When defining this reproduction matrix, the researchers relied on data from other studies. For their model, they divided society into groups according to age. On average, people between the ages of 10 and 25 have the most contacts. "This grouping by age is of course a generalization, real social contacts are more complex," explains Lunati. "In addition, our model assumes that both the infections and the superspreaders are evenly distributed throughout the country. For small countries with well-connected regions and relatively uniform social structures, this assumption is not very problematic. For large countries, however, we would also have to take into account the geographical distribution of the population and the contacts between the regions."
The researchers tested their new model with Covid data from Switzerland and Scotland - both relatively small countries. They were able to show that the matrix enables much more accurate predictions of infection peaks. "Of course, our model is also highly simplified," says Lunati. However, the strength of the matrix model lies precisely in its simplicity: "It is very easy to use, but at the same time much more realistic than the R-value alone."
The usefulness of the new model is not limited to epidemics: It can be used in different systems - whenever objects spread across a network. In future, the researchers want to use it to simulate the spread of views, opinions and behaviors in a society - for example, when it comes to the adoption of new technologies or a sustainable way of life.
Source: Empa


